S&P 500: A Remarkable Journey

Resilience & Performance

Over the last six decades, the S&P 500 Index has embodied the resilience and ever-evolving nature of the stock market. Currently, we are witnessing a fascinating chapter in this narrative. Despite robust economic growth and escalating interest rates, the S&P 500 has impressively climbed over 24% to date. This exceptional performance occurs amidst a stable unemployment rate, recorded at 3.7% in November, alongside inflation rates that are beginning to show signs of easing.

60 Years of Stock Market Cycles
Visualizing 60 Years of Stock Market Cycles

Understanding Market Cycles: Bulls and Bears

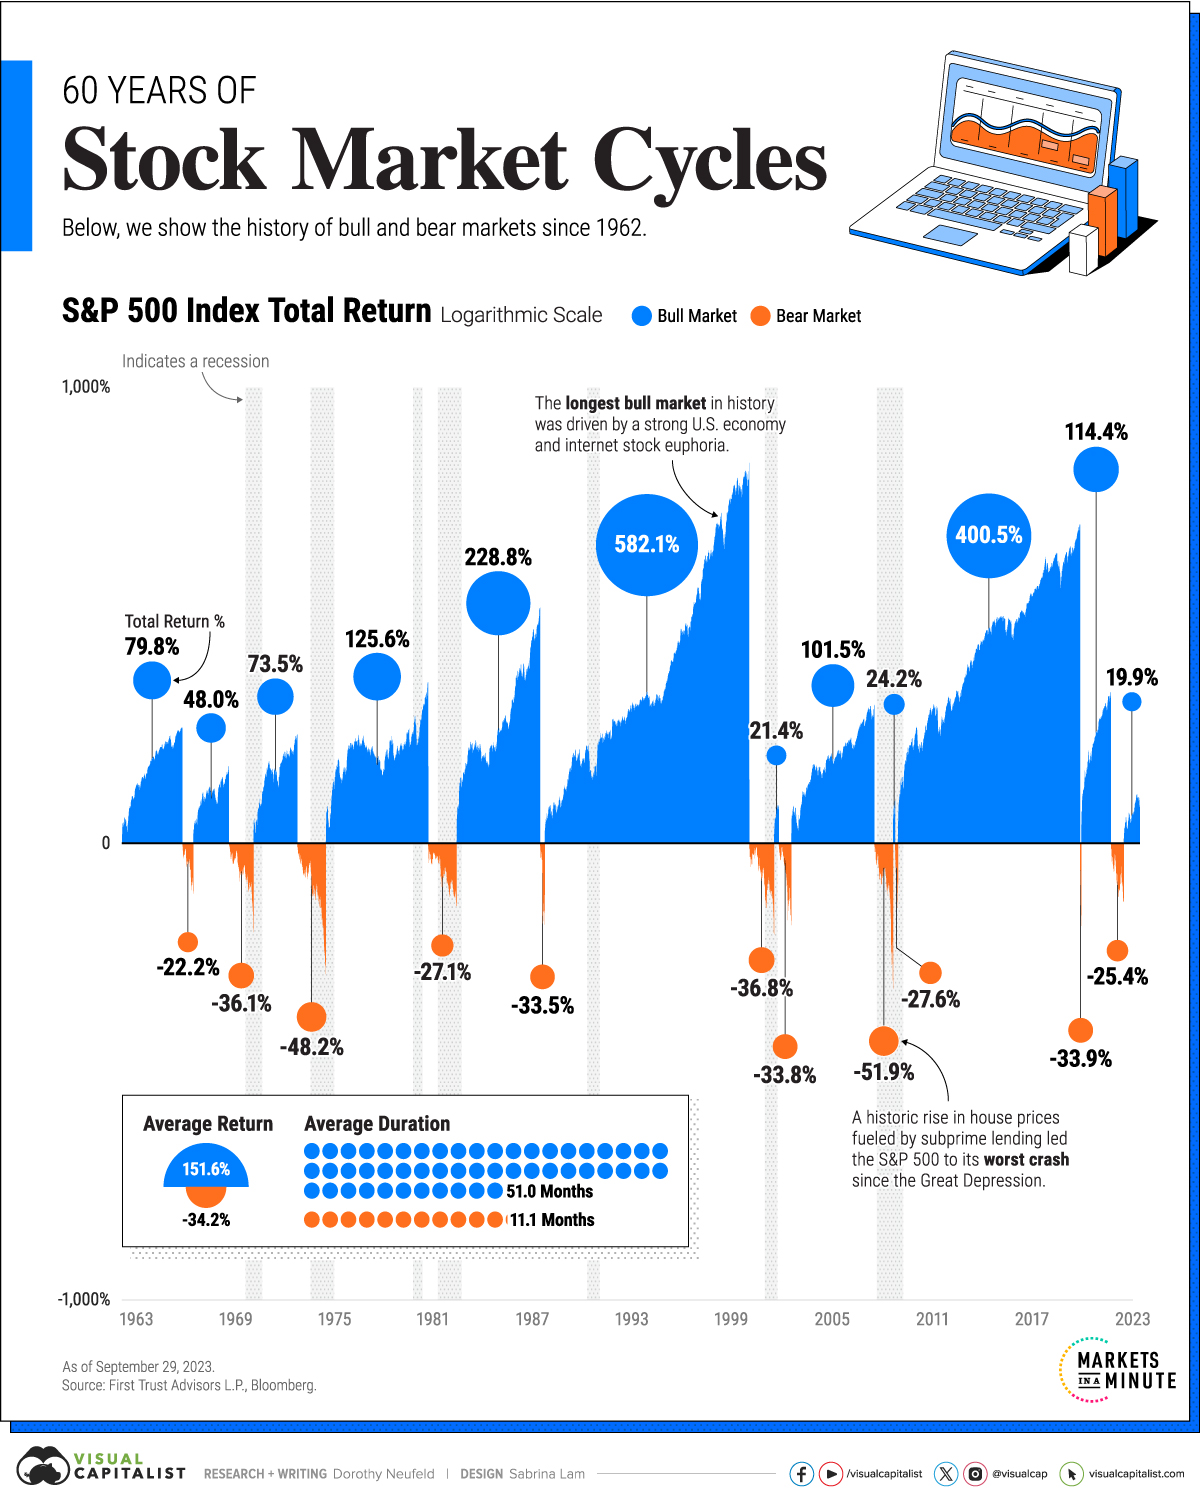
The stock market’s cyclical nature is marked by alternating bull and bear phases. A bear market, identified by a decline of 20% or more from a market index’s peak, signals a downturn. In contrast, a bull market signifies a rebound and a rise above the previous peak, which can span months or years.

An analysis of historical data since 1962 reveals these patterns:

Bull Markets: Typically, bull markets have average returns* of +151.6% and have an average duration of 51.0 months.

Bear Markets: In comparison, bear markets have witnessed an average decline* of -34.2%, typically lasting 11.1 months.

* As of September 29, 2022

Notably prolonged bear markets in the early 1970s and 1980s, each extending around 20 months, were largely driven by high inflation and Federal Reserve’s monetary policies leading to recessions. The year 1974, for instance, saw a drastic 48.2% fall in the S&P 500, one of the sharpest post-WWII downturns.

The 1990s: A Decade of Prosperity and the Bull Market

The 1990s experienced the longest bull market, driven by a strong U.S. economy, culminating in the Dotcom bubble. Over 12 years, the S&P 500 surged by 582.1%. Following the 2008 Global Financial Crisis, another significant bull market emerged, lasting 11 years, marked by low-interest rates and the rapid growth of major tech companies.

Market peaks often herald economic recessions. For instance, the S&P 500 peaked in October 2007, shortly before the recession onset in December. Similarly, the peak in September 2000 preceded the recession that began in March 2001.

Strategies for Mitigating Bear Market Risks

Predicting the start of a bear market is challenging, but investors can adopt strategies to fortify their portfolios:

As of September 29, 2023, the S&P 500 has returned an average of +11.5% since 1928. Most stock market cycles have favored bull markets, indicating a prevailing trend of growth over decline in the long-term.

Sector Diversification: Allocating investments across various sectors can be beneficial. Cyclical sectors like technology and real estate often excel in bull markets, while defensive sectors like consumer staples are more resilient in downturns.


Asset Class Diversification: Integrating bonds offers risk mitigation due to their consistent cash flows and low correlation with stocks. Additionally, international stocks, less linked with U.S. equities, provide a buffer in times of domestic market dips.

Embracing an Optimistic Market Perspective

The current trend in the stock market leans positively, with bull markets typically outlasting and outperforming bear markets substantially. As investors traverse the complexities of these cycles, diversification emerges as a fundamental strategy for resilience and leveraging long-term growth opportunities.

S&P 500 remarkable journey performance growth bull market
Disclaimer
The content on this site, provided by Able Wealth Management, is purely informational. While we aim for accuracy and completeness, we cannot guarantee the exactness of the information presented. The views and analyses expressed in this blog represent those of the authors at Able Wealth Management. They should not be considered as investment advice or endorsement of any particular financial instrument or strategy. Any references to specific securities and their performance are purely informational and should not be taken as advice to buy or sell.Before implementing any information or ideas presented, we strongly advise consulting with a financial advisor, accountant, or legal counsel. Investing carries inherent risks, including potential capital loss. Asset values can fluctuate over time and may be worth more or less than the original investment. Past performance does not guarantee future results, and Able Wealth Management cannot ensure that your financial goals will be achieved. Information from third-party sources has not been independently verified by Able Wealth Management. Although we trust these sources, we cannot assure their accuracy or completeness.

Schedule an appointment

Volatility Drag

Volatility drag, often unnoticed by many investors, plays a significant role in the performance of investment portfolios, especially in markets characterized by high volatility. Understanding volatility drag is crucial for making informed investment decisions and managing long-term investment performance.

Understanding Volatility Drag

Volatility drag refers to the negative effect of investment volatility on compound returns over time. It occurs because losses have a more significant impact on portfolio value than gains of the same magnitude. For example, if an investment loses 10% one year and gains 10% the next, the investment will not return to its starting value due to the mathematical asymmetry between gains and losses. This phenomenon underscores the importance of minimizing large fluctuations in investment value to protect long-term returns.

The Mathematics Behind Volatility Drag

The mathematical principle underlying volatility drag is relatively straightforward but profound in its implications for investors. The key concept is that percentage gains and losses are not symmetrical. A 50% loss requires a 100% gain to break even, not a 50% gain. This asymmetry means that volatility (up and down movements in price) can erode the compound growth rate of an investment, even if the arithmetic mean of the returns seems healthy.

Example of Volatility Drag

Consider an investment with the following annual returns: +20%, -15%, +10%, and -5%. While the arithmetic mean of these returns might suggest a modest positive performance, the compound annual growth rate (CAGR) would tell a different story, factoring in the volatility drag and showing a lower effective return than the arithmetic mean would suggest.

Implications for Investors

  • Risk Management: Understanding volatility drag emphasizes the importance of risk management strategies, such as diversification and the use of derivatives for hedging, to minimize significant downturns in portfolio value.
  • Investment Strategy: Investors might consider investment strategies that aim for steady, consistent returns over those with potentially higher but more volatile returns. Such strategies might include investing in low-volatility stocks, index funds, or using dollar-cost averaging to mitigate the impact of market fluctuations.
  • Psychological Aspects: Volatility drag also highlights the psychological challenge for investors who may overreact to short-term market movements. A long-term perspective is crucial for successful investing, as frequent trading in response to volatility can exacerbate the drag on returns.
  • Performance Evaluation: When assessing investment performance, considering both the arithmetic mean return and the compound annual growth rate (CAGR) can provide a more comprehensive view of an investment’s performance, factoring in the effect of volatility.

Financial Planning Fees

Plan Type
Sources of Income (select all that apply)
Additional Considerations
Total Fee: $0
  • Fees can be paid monthly, quarterly or semi annually
  • Actual fee will be determined on complexity and scope after an initial consultation
Investment Advisory Fees


Fee Rate: %


Annual Fee: $

  • Fee charged on a percentage-tiered rate
  • Fee based on total assets managed
  • Fee covers services such as portfolio design, continuous monitoring, rebalancing, and personalized guidance

Join Our Mailing List