Decoding the Market Correction: Insights and Implications for Long-Term Investors

Recently, the market dipped into correction territory, typically characterized as a 10% drop from the previous peak, creating a contradiction with numerous indicators of a robust underlying economy. Since July’s end, the S&P 500 has retreated by 10.3% due to factors such as rising interest rates, Fed policy, sluggish growth in China, political uncertainty in Washington, and more. Even at its recent peak, the market hadn’t fully rebounded from the previous year’s bear market, falling short of its all-time high by 4.3% at 2022’s onset. However, the S&P 500 has still seen a 7.2% gain year-to-date, with the Nasdaq rising 20.8%.

Tech Stocks Driving Market Volatility

Amid these macroeconomic concerns, technology stocks have been pivotal in both the highs and lows of major indices. A cluster of these high-performing stocks, now dubbed the “Magnificent 7” – Apple, Microsoft, Alphabet, Amazon, Meta, Nvidia, and Tesla – have seen an average gain of 77% in 2023, significantly influencing the returns of both the Nasdaq and S&P 500. Over the past five years, they have soared 211%, compared to 41% for the Nasdaq and 27% for the S&P 500.

A small group of stocks has driven market swings this year

The Impact of Rising Interest Rates on Tech Stocks

Two conflicting forces affecting tech sector volatility are enthusiasm for emerging technologies such as artificial intelligence and rising interest rates. When interest rates increase, the value of future money diminishes. This means that rising rates present more appealing investment opportunities. This can disproportionately impact tech stocks as they rely on the promise of future innovation and commercialization, which could be years or even decades away. With the 10-year Treasury yield briefly surpassing 5%, the highest level since 2007, interest rates have not only risen but have also dragged down the overall market.

Stronger Than Anticipated Economy

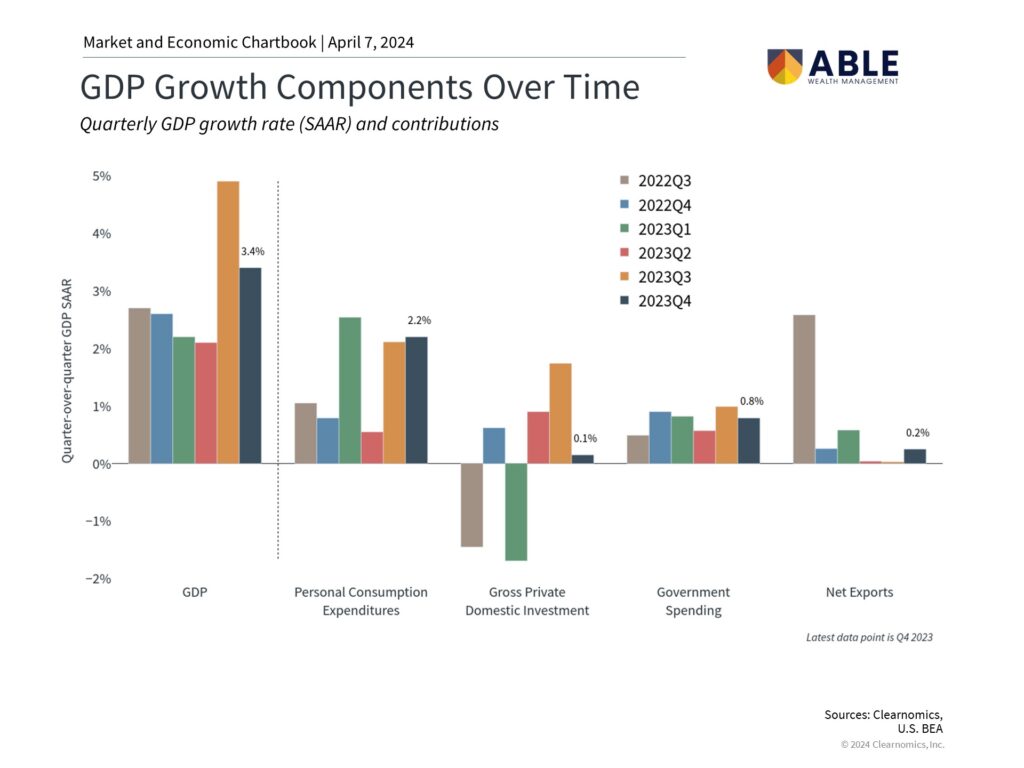
The cognitive dissonance for some investors may stem from these market shifts occurring while the economy is performing significantly better than previously expected. The recent third-quarter GDP report exceeded economists’ predictions from just a few months prior. The economy grew at an annualized rate of 4.9% quarter-over-quarter, even after adjusting for inflation, with growth spanning consumer goods and services purchases, business investment, and government spending.

The economy is far stronger than anticipated

Concerns Over Future Growth

However, some investors are understandably apprehensive about the sustainability of this growth, fearing a potential recession if rates stay high and the Fed tightens further. There are also concerns that consumer spending could slow as households deplete their excess savings and private investment could decelerate as business inventory buildup reverses.

Navigating Market Corrections

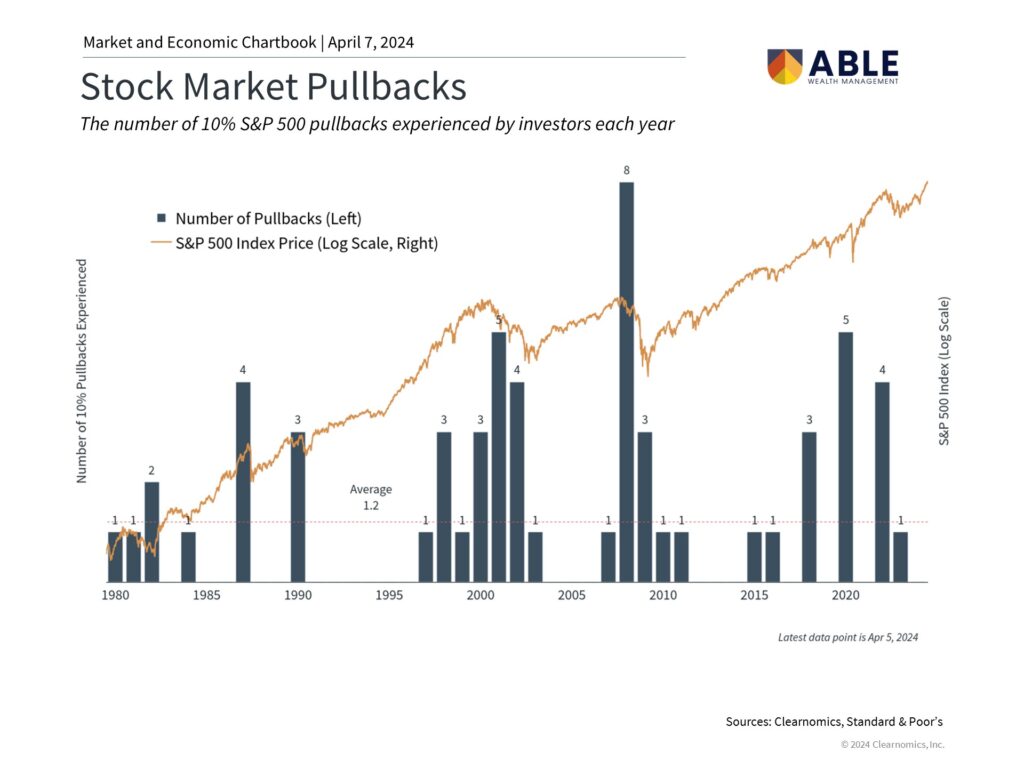
So, how should investors respond when markets tumble despite strong fundamentals? The chart above serves as a reminder that market corrections are a routine part of both good and bad years, even during strong bull markets. When corrections happen, markets often drop by 14% or more. Despite this, major indices typically recover within a few months.

Market corrections occur regularly
Conclusion

Despite numerous indicators of economic strength, the market recently dipped into correction territory. Investors should focus on broader trends instead of reacting to daily market fluctuations.

Disclaimer
The content on this site, provided by Able Wealth Management, is purely informational. While we aim for accuracy and completeness, we cannot guarantee the exactness of the information presented. The views and analyses expressed in this blog represent those of the authors at Able Wealth Management. They should not be considered as investment advice or endorsement of any particular financial instrument or strategy. Any references to specific securities and their performance are purely informational and should not be taken as advice to buy or sell.Before implementing any information or ideas presented, we strongly advise consulting with a financial advisor, accountant, or legal counsel. Investing carries inherent risks, including potential capital loss. Asset values can fluctuate over time and may be worth more or less than the original investment. Past performance does not guarantee future results, and Able Wealth Management cannot ensure that your financial goals will be achieved. Information from third-party sources has not been independently verified by Able Wealth Management. Although we trust these sources, we cannot assure their accuracy or completeness.

Schedule an appointment

Volatility Drag

Volatility drag, often unnoticed by many investors, plays a significant role in the performance of investment portfolios, especially in markets characterized by high volatility. Understanding volatility drag is crucial for making informed investment decisions and managing long-term investment performance.

Understanding Volatility Drag

Volatility drag refers to the negative effect of investment volatility on compound returns over time. It occurs because losses have a more significant impact on portfolio value than gains of the same magnitude. For example, if an investment loses 10% one year and gains 10% the next, the investment will not return to its starting value due to the mathematical asymmetry between gains and losses. This phenomenon underscores the importance of minimizing large fluctuations in investment value to protect long-term returns.

The Mathematics Behind Volatility Drag

The mathematical principle underlying volatility drag is relatively straightforward but profound in its implications for investors. The key concept is that percentage gains and losses are not symmetrical. A 50% loss requires a 100% gain to break even, not a 50% gain. This asymmetry means that volatility (up and down movements in price) can erode the compound growth rate of an investment, even if the arithmetic mean of the returns seems healthy.

Example of Volatility Drag

Consider an investment with the following annual returns: +20%, -15%, +10%, and -5%. While the arithmetic mean of these returns might suggest a modest positive performance, the compound annual growth rate (CAGR) would tell a different story, factoring in the volatility drag and showing a lower effective return than the arithmetic mean would suggest.

Implications for Investors

  • Risk Management: Understanding volatility drag emphasizes the importance of risk management strategies, such as diversification and the use of derivatives for hedging, to minimize significant downturns in portfolio value.
  • Investment Strategy: Investors might consider investment strategies that aim for steady, consistent returns over those with potentially higher but more volatile returns. Such strategies might include investing in low-volatility stocks, index funds, or using dollar-cost averaging to mitigate the impact of market fluctuations.
  • Psychological Aspects: Volatility drag also highlights the psychological challenge for investors who may overreact to short-term market movements. A long-term perspective is crucial for successful investing, as frequent trading in response to volatility can exacerbate the drag on returns.
  • Performance Evaluation: When assessing investment performance, considering both the arithmetic mean return and the compound annual growth rate (CAGR) can provide a more comprehensive view of an investment’s performance, factoring in the effect of volatility.

Financial Planning Fees

Plan Type
Sources of Income (select all that apply)
Additional Considerations
Total Fee: $0
  • Fees can be paid monthly, quarterly or semi annually
  • Actual fee will be determined on complexity and scope after an initial consultation
Investment Advisory Fees


Fee Rate: %


Annual Fee: $

  • Fee charged on a percentage-tiered rate
  • Fee based on total assets managed
  • Fee covers services such as portfolio design, continuous monitoring, rebalancing, and personalized guidance

Join Our Mailing List