Understand How Loss Aversion and the Sequence of Returns Impact Your Investments
On February 9, 2024, the S&P 500 index marked a historic milestone by soaring past the 5,000 mark, just three years after surpassing the 4,000 threshold. This rapid growth, while inspiring optimism about future market potentials, might also awaken feelings of unease among investors due to loss aversion and the unpredictable sequence of returns. The fear of losing money can sometimes overshadow the thrill of potential gains, leading investors to react emotionally to short-term market fluctuations. The thought of managing investment losses and maintaining focus and discipline become a challenge for many amidst this dynamic. How can an investor navigate this landscape effectively?
Calculating Breakeven Returns: The Gain Needed to Recover from a Loss
Recent bullish trends in the market, bolstered by expectations of Federal Reserve rate cuts and subsiding inflation, contrast sharply with the bearish phase of 2022, now a distant memory. Yet, economic uncertainties linger. While capitalizing on a rising market is crucial, risk management remains paramount. Investors must prepare for both short-term volatility and long-term strategy execution, bearing in mind several key principles:
- Design portfolios for growth with risk mitigation strategies.
- Establish contingency plans for enduring market downturns.
- Resist the temptation to forsake balanced investment approaches due to overly optimistic market sentiments.
- Acknowledge that economic disruptions can still pose challenges to market growth.
- Embrace preparedness and discipline, even during bullish phases.
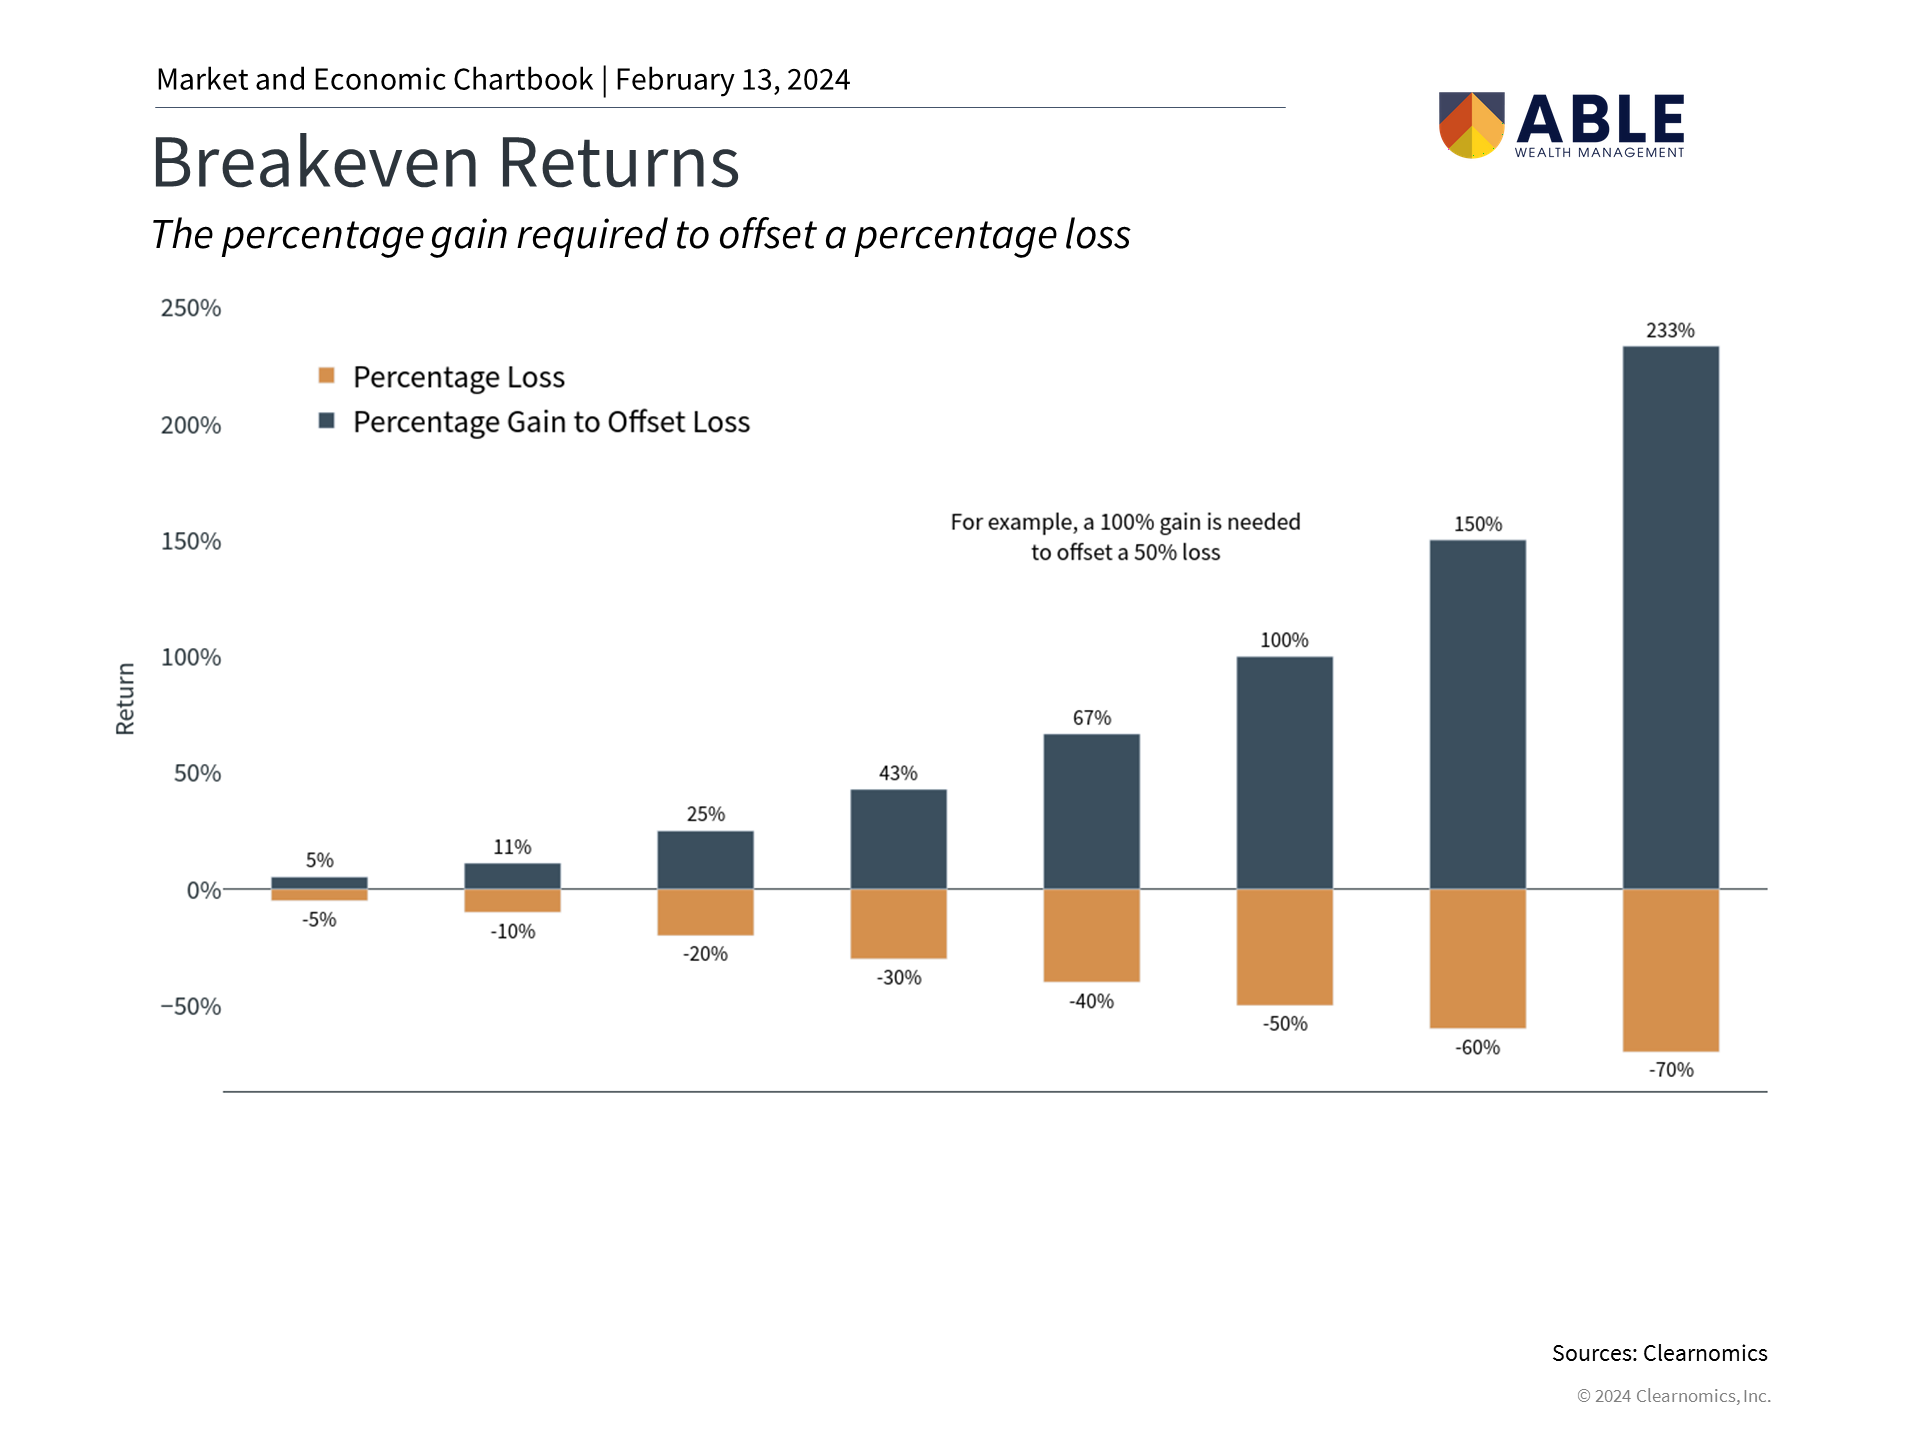
Historical downturns, such as the nearly 50% fall in 2008 or 34% in 2020, illustrate the daunting task of recovery. However, market resilience over time demonstrates that patience and commitment are key to overcoming these challenges. Avoiding the temptation to time the market is crucial, as is the commitment to stay invested through the fluctuations.
Graph showing how much your investments need to grow to make up for losses. Even a small loss requires a bigger gain to get back to where you started.
Investment Recovery Calculator

This calculator can assist you in comprehending the concept of volatility drag or how much your investments must grow to recuperate from a loss (managing investment losses). You can input a hypothetical investment value and the amount of loss to calculate the percentage your investments must gain to return to your starting point.
Disclaimer: The Portfolio Recovery Calculator is for informational and educational purposes only and should not be taken as financial advice or investment recommendations. It aims to illustrate the recovery process from financial losses, emphasizing the importance of understanding market dynamics. Results depend on user-provided information and do not guarantee future investment performance. Investors are advised to assess their financial situation, goals, and risk tolerance, and consider consulting a financial advisor before making investment decisions. Our firm is not liable for any decisions made based on this calculator’s use, and using it does not establish a professional-client relationship. This calculator is intended only to help illustrate the concept of managing investment losses.
Smooth Investment Paths: Key to Sticking with Long-Term Plans
Investing is not just about numbers and ratios, but also involves understanding emotions and biases. A key principle in behavioral economics is loss aversion – the idea that losses loom larger than equivalent gains in our minds. Research shows that losing $100 induces twice as much psychological pain as gaining $100 pleasure. This asymmetry can skew investment decisions.
When markets drop, loss aversion kicks in. Investors become anxious about protecting their nest egg instead of thinking long-term. Some panic and sell at the wrong time, cementing losses. Others get paralyzed by fear and miss opportunities. Such reactions are instinctive but often counterproductive.
Analysis of four asset allocation portfolios since the 2008 financial crisis suggests that diversified portfolios offer a balanced approach to achieving solid returns while mitigating the risk of substantial losses. Such strategies encourage investors to remain dedicated to their financial goals, even in the face of adversity.
How Reacting to Market Ups and Downs Impacts Your Future Investments
Market volatility can significantly compromise your long-term investment returns, especially if you withdraw funds during temporary downturns. Our emotional reactions to market fluctuations often provoke short-sighted decisions that hurt long-term performance. This risk tied to poor market timing is called “sequence of returns” risk – the risk that the specific order and timing of investment returns over time can greatly impact overall earnings.
Essentially, the sequence of returns risk refers to the vulnerability of a portfolio to volatility coinciding with periodic withdrawals. By anticipating periods of turbulence, investors can mitigate emotion-driven actions and remain committed to a structured long-term plan that supports their goals. Staying the course with a diversified portfolio can help navigate uncertain times.
| Hypothetical Investment Returns: Years 1 - 5 | ||||||
|---|---|---|---|---|---|---|
| Portfolio | Year 1 | Year 2 | Year 3 | Year 4 | Year 5 | Annualized |
| Investor 1 | -10% | -12% | +15% | +20% | +7% | 3.18% |
| Investor 2 | +7% | +20% | +15% | -12% | -10% | 3.18% |
Example:
Let’s consider the scenario of two investors, Investor 1 and Investor 2, who both retire with a $1 million portfolio and plan to withdraw $40,000 annually, adjusted for inflation, to cover their living expenses. The difference between them lies in the sequence of investment returns they experience in the early years of their retirement.
Both Investor 1 and Investor 2 face an average return rate of 3.18%, but the timing of their gains and losses differs. Investor 1 experiences significant losses early on, while Investor 2 sees substantial gains in the initial years.
Impact After 5 Years:
Investor 1 has experienced early losses and ongoing withdrawals which have significantly reduced their portfolio. As a result, there is less capital in their account to recover when the market improves. By the end of the fifth year, their portfolio may have dwindled to approximately $750,000 despite the market rebounding in years 3 and 4.
On the other hand, Investor 2’s portfolio has experienced strong early gains, which provides a buffer against withdrawals. The early appreciation helps to sustain the portfolio’s value. Even after the market downturns in years 4 and 5, Investor 2’s portfolio might stand at around $1.1 million, benefiting from the early growth that compounds over time.
The key takeaway:
- Don't panic and make sudden, big changes to your portfolio due to short-term market ups and downs. Instead, stick to a sensible long-term investment plan.
- Patience helps reduce sequence risk since market swings tend to even out over time.
- If you can, avoid making major adjustments to your portfolio early in retirement. Drastic changes in reaction to dips can cement losses right before a potential rebound.


